Optimal server estimate with Markov chains
I was learning about Markov chains while reading about Hidden Markov Models (HMMs), they are used in understanding and decoding the meaning behind speech. Working on system design and architecture concepts, I saw an analogy of this concept, for using them for finding an optimal number of servers for your micro-service.
This post has been long overdue though, since July 16 to be precise, the day 'Amazon Prime-Day' took place this year ; the post is inspired by that busy day for servers, where multiple customer requests hop from one server to another, sporadically sky-rocketing the read/write load on the them.
For lucidity and ease of understanding, consider that there are only 5 categories and data for each category is in a separate server, and each server can serve \(100k\) customers. The most important problem for Amazon is optimizing the number of servers for each category. Let's say that through deep-learning algorithms and yada-yada we can predict the total number of customers in each category at a given time, but unfortunately, people shift from one category to another at random in a frenzy mode to buy all that they can. The only thing we have is the probability of the fluctuation of a customer to a given category each minute.
If a customer is at books, there is \((a*100)\%\) chance they'll stay there, \((b*100)\%\) chance that they'll shift to electronics... and so on. We can visualize this as a graph of customer fluctuation with the probabilities as \(a, b, c, d, e\) :

The problem we have delineated so far is formally called a Markov Chain. The thing that makes this a Markov Chain, is that each customer transitions from each state in a probabilistic way and the only state that matters is the one where the customer currently is in.
Let's say we have a total of \(100\) customers initially in Toys and only care about the expected people in Toys, and let \(N_{toys1} , N_{toys2}, ...\) be the number of people in Toys at a time \(t = 1,2, 3 ...\) and let \(P\) be the probability of transitions. The first thing is to know the number of people expected to stay in Toys, i.e,
\[ E[N_{toys1}] = P_{toys->toys} * N_{toys0} = s *100 \]
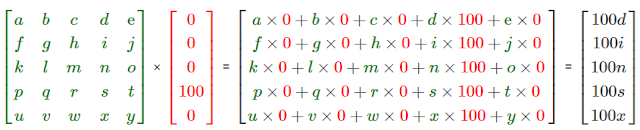
Similarly we calculate for all other states at time \(t=1\) , i.e, \( E[N_{books1}] , E[N_{sports1}] , ...etc \) , or simply put, we can get the value of each state as follows :

Similarly we can calculate the population for \(t = 3,4,5,6 ....\). The interesting observation was that after a certain amount of steps the population becomes stationary. This means that the result at time \(t=20\) ,i.e, after 20 steps is the same as the result after, say, 300 steps. And what is even more phenomenal is that no matter what initial population, the ending distribution of the population remains the same !
With this we can calculate the optimal amount of servers to be given for each category. Here, the categories are also analogous to micro-services in a service-based architecture and the customers are the number of requests each server faces.
This post has been long overdue though, since July 16 to be precise, the day 'Amazon Prime-Day' took place this year ; the post is inspired by that busy day for servers, where multiple customer requests hop from one server to another, sporadically sky-rocketing the read/write load on the them.
For lucidity and ease of understanding, consider that there are only 5 categories and data for each category is in a separate server, and each server can serve \(100k\) customers. The most important problem for Amazon is optimizing the number of servers for each category. Let's say that through deep-learning algorithms and yada-yada we can predict the total number of customers in each category at a given time, but unfortunately, people shift from one category to another at random in a frenzy mode to buy all that they can. The only thing we have is the probability of the fluctuation of a customer to a given category each minute.
If a customer is at books, there is \((a*100)\%\) chance they'll stay there, \((b*100)\%\) chance that they'll shift to electronics... and so on. We can visualize this as a graph of customer fluctuation with the probabilities as \(a, b, c, d, e\) :
This graph is shown only for the category of books. If all categories were taken into account it would result in a complex directed graph (which I will not be making at the moment!) But we can represent that data in a an easier fashion by putting it into a table (popularly known as an adjacency matrix among the computer scientists ) :
  from ->    | Books | Electronics | Apparels | Toys | Sports |
------------ +-------+-------------+----------+------+--------+
Books        | a     | b           | c        | d    | e      |
             +-------+-------------+----------+------+--------
Electronics  | f     | g           | h        | i    | j      |
             +-------+--------- ---+----------+------+--------
Apparels     | k     | l           | m        | n    | o      |
             +-------+-------------+----------+---------------
Toys         | p     | q           | r        | s    | t      |
             +-------+-------------+----------+------+--------
Sports       | u     | v           | w        | x    | y      |
             +-------+-------------+----------+------+---------
The problem we have delineated so far is formally called a Markov Chain. The thing that makes this a Markov Chain, is that each customer transitions from each state in a probabilistic way and the only state that matters is the one where the customer currently is in.
Let's say we have a total of \(100\) customers initially in Toys and only care about the expected people in Toys, and let \(N_{toys1} , N_{toys2}, ...\) be the number of people in Toys at a time \(t = 1,2, 3 ...\) and let \(P\) be the probability of transitions. The first thing is to know the number of people expected to stay in Toys, i.e,
\[ E[N_{toys1}] = P_{toys->toys} * N_{toys0} = s *100 \]
Similarly we calculate for all other states at time \(t=1\) , i.e, \( E[N_{books1}] , E[N_{sports1}] , ...etc \) , or simply put, we can get the value of each state as follows :
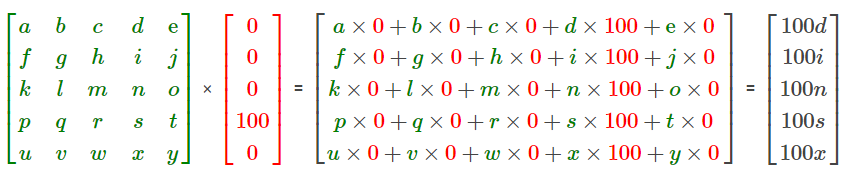
This makes things much easier (God bless matrix multiplication !) Now we have the population of all the other states. Now to calculate at time \(t=2\), we have \( E[N_{toys2}] , E[N_{books2}] , ...etc \) . We can simply do this by doing a matrix multiplication with the current population :
With this we can calculate the optimal amount of servers to be given for each category. Here, the categories are also analogous to micro-services in a service-based architecture and the customers are the number of requests each server faces.


Comments
Post a Comment